Michael Miller

Husband, Father, Podcaster, Data Professional
I build end-to-end data reporting pipelines — Microsoft Fabric, Power BI, SQL, Python, and BigQuery.
View My LinkedIn Profile
Arabica Coffee Exploration
Project description: I got interested in how a coffee’s Q-grade affects its price, but that led to a more foundational question — what determines the score in the first place? A Q-grader evaluates coffee in a process called cupping, brewing each sample with the same ratio of coffee to water so they can be compared directly. The Specialty Coffee Association sets the protocol: graders score Fragrance/Aroma, Flavor, Aftertaste, Acidity, Body, Balance, Uniformity, Clean Cup, Sweetness, Defects, and Overall, each from 6 to 10 in quarter-point increments.
This analysis asks whether two things a grower actually controls — variety and growing altitude — show up in the final cupping score.
Many have speculated that higher altitudes affect the cup, producing a sweeter taste than coffee grown lower down.
The data
The Coffee Quality Institute database, via a Kaggle dataset originally scraped and cleaned
by James LeDoux from CQI in January 2018. The Arabica table is 1,311 rows and 43 columns,
but only three mattered here: Variety, Total.Cup.Points, and altitude_mean_meters.
Cleaning decisions
Most of the work was deciding what to trust.
Altitude. The raw Altitude column is text — hyphens, ranges, unit letters mixed in.
altitude_mean_meters is numeric and had only four more nulls, so I used it instead and
verified it against the parsed Altitude values before relying on it. The wrinkle was
unit_of_measurement, which holds both m and ft — 973 records in meters, 111 in feet.
Meters was chosen over feet because most coffee-producing countries work within the metric system.
Scores. Some rows had a Total.Cup.Points of 0, which isn’t a real grade, so those
came out. A handful of genuine outliers below 70 also came out — the mean moved from
82.18 to 82.26, which tells you how few they were.
Varieties. Nulls and the literal value Other both mean the same thing in practice:
the variety wasn’t known. Ethiopian heirloom coffees are often genuinely unclassified.
Varieties with fewer than 10 records were dropped, since a box plot of three observations
says nothing.
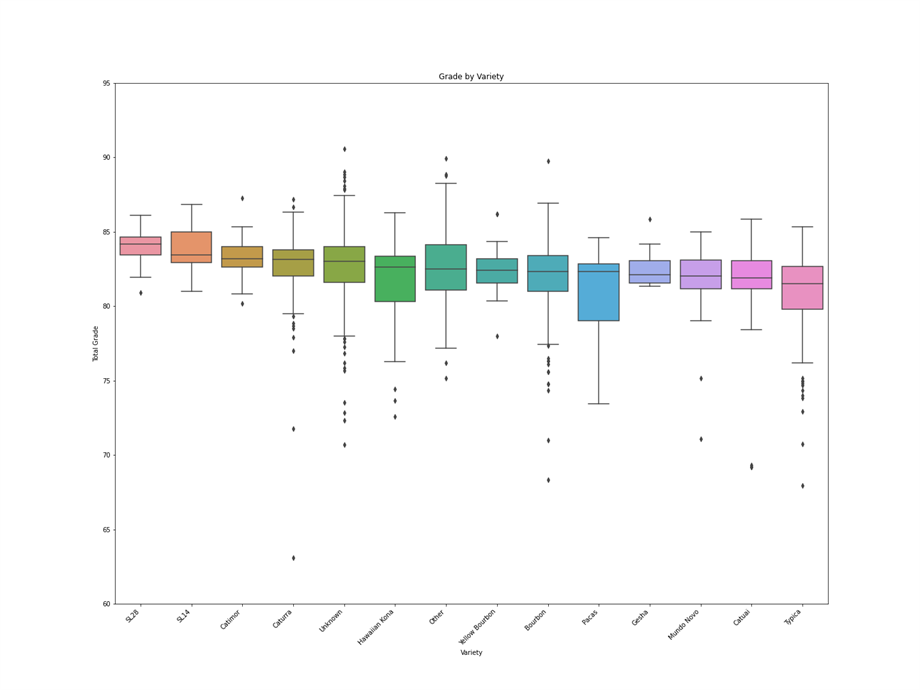
Variety against cupping score
What stands out:
- The varieties are far more alike than I expected. Every one clusters around the low 80s. Variety alone doesn’t separate a good cup from a mediocre one.
- Gesha underperforms its reputation. It’s widely treated as one of the great coffees, and its cupping scores here don’t reflect that. Part of that is sample size — Gesha has relatively few records, so the gaps are wider than you would expect. Still, a coffee that dominates the competitive scene should score higher than it did here.
- The top three are East African — Kenya, Malawi, and Zimbabwe varieties — with Caturra breaking the pattern as a primarily South American varietal.
- The outliers are the real story. The spread within a single variety is wide enough that where and how a coffee was grown clearly matters more than what it is.
- The box plot shows the spread. It puts the deviation and the median in view, which a bar chart of averages would have hidden.
Altitude against cupping score
A simple linear regression of altitude against total cup score points the way you’d expect: scores improve as coffee is grown higher. To check whether that’s real rather than an artifact of variety mix, I ran a one-way ANOVA and followed it with Tukey HSD for the pairwise comparisons.
The pairwise results were more interesting than the headline: only Bourbon and Typica were statistically similar to each other, and Caturra sits well apart from everything else.
Binning both dimensions makes the pattern concrete — altitude in four bands against the SCA quality tiers:
| 525–1200 m | 1200–1350 m | 1350–1600 m | 1600–2500 m | |
|---|---|---|---|---|
| Below Specialty Quality | 58 | 49 | 26 | 7 |
| Very Good | 251 | 141 | 203 | 202 |
| Excellent | 5 | 12 | 13 | 37 |
| Outstanding | 0 | 0 | 0 | 1 |
Below-specialty coffees thin out as you climb, and every Excellent-and-above coffee is concentrated at the top band.
While the trend line shows that higher altitudes produce better coffee, running ANOVA and Tukey HSD across the four most-tasted varietals is what tests how true that line really is.
Altitude and variety both matter, but not every coffee is better at higher altitude. Different varieties grow best at different altitudes.
What I’d do differently
The altitude column has values ranging from 1 metre to 190,164 metres, which is obviously not real — some of it is unit confusion, some is likely data entry error at the certification stage.
Not all coffees had many records, which caused problems once I started looking deeper into the altitude question — the varieties I most wanted to compare were often the ones with the fewest observations.
Originally completed as the final project for the Codecademy Data Analysis path.